Late last month, the Associated Press ran a report about economic insecurity that managed to gain some traction in certain parts of the political internet, and since then, again and again in certain relevant debates. The statistical bomb dropped in the first sentence of the report really says it all:
Four out of 5 U.S. adults struggle with joblessness, near poverty or reliance on welfare for at least parts of their lives, a sign of deteriorating economic security and an elusive American dream.
To be clear, this figure pertains to the percentage of people facing these problems at least once in their life, not the percentage of people facing them right now. Also, it should be noted that this figure cannot, by itself, be a sign of deteriorating economic security. To show things are deteriorating, you'd have to know whether this figure used to be lower than 80 percent, and we do not know that.
Shortly after the AP report blew up, the Wall Street Journal's James Taranto responded with a few criticisms that are worth reading. Taranto argues that using near-poverty to derive the figure (meaning 150 percent of the poverty line) instead of the poverty line is arbitrary. Taranto also takes issue with the joblessness part of the figure because it counts even a day of joblessness, and takes issue with counting anyone who has ever received welfare benefits into the figure as well.
In light of Taranto's criticisms, an interesting question presents itself: What would this figure look like if it did not include those features which Taranto objects to? If we used the poverty line instead of the near-poverty line and did not include joblessness or welfare receipt into the calculation, how much lower would the figure be? Lucky for us, in a variety of papers and books that came out in the late 1990s and early 2000s, Mark Rank and Thomas Hirschl published data on precisely this question.
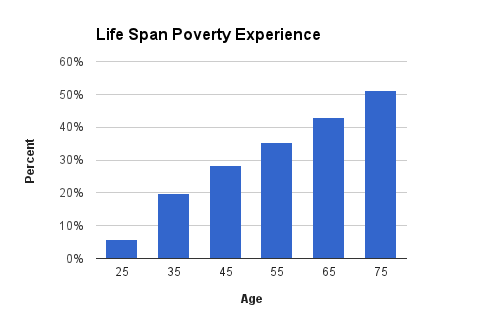
In their 2001 paper, Rank and Hirschl used PSID data to determine that 51 percent of people experience poverty (as defined by the Census) at some point in in their life between the ages of 25 and 75.
So in this graph, you notice that at age 25, around 6 percent of people have experienced poverty (presumably in that very year). And then from there, the number grows and grows. It cannot decline obviously because you cannot un-experience poverty. By the time folks reach age 75, 51 percent of them have experienced at least one year of poverty.
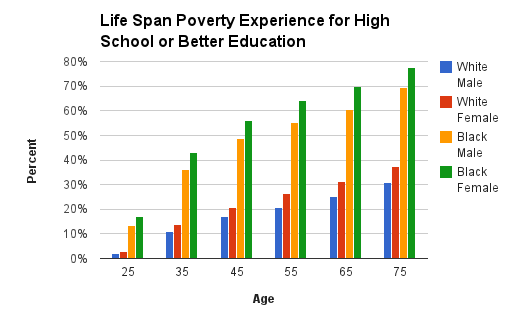
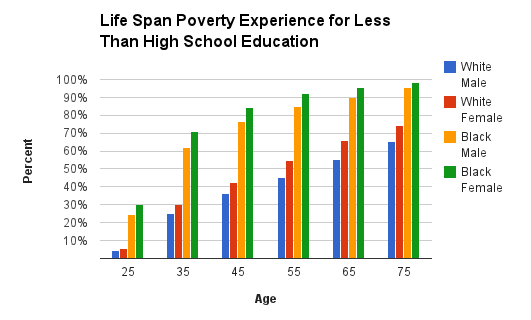
But as with all things economic, the aggregate picture obscures the fact that some demographics (namely women and people of color) have it much worse.
On the most extreme end, 98.3 percent of black women who have less than a high school education experience poverty at some point in their lives. For black women who have a high school education or greater, the figure is still a very high 77.5 percent, compared to just 30.7 percent for white males with a high school education or greater.
So even if you get rid of the various enhancements that the Journal's Taranto takes issue with, the picture is still pretty grim. A slight majority of people still spend at least one year of their adult life in poverty, and for some demographic groups, almost everyone experiences poverty at some point. The ultimate figure is not as high as 80 percent, but troubling nonetheless.


